Platform
One platform. Eleven modules. Your licence decides which are on.
Prosperus is multi-tenant and white-label. Each tenant switches on the modules it is licensed for and the menu adjusts to match. Every module below shares the same data, roles and audit trail.
The actual product
Screens from the platform, not illustrations
Captured from a working tenant running sample data. Every firm runs Prosperus under its own branding, so your logo sits where this one does.
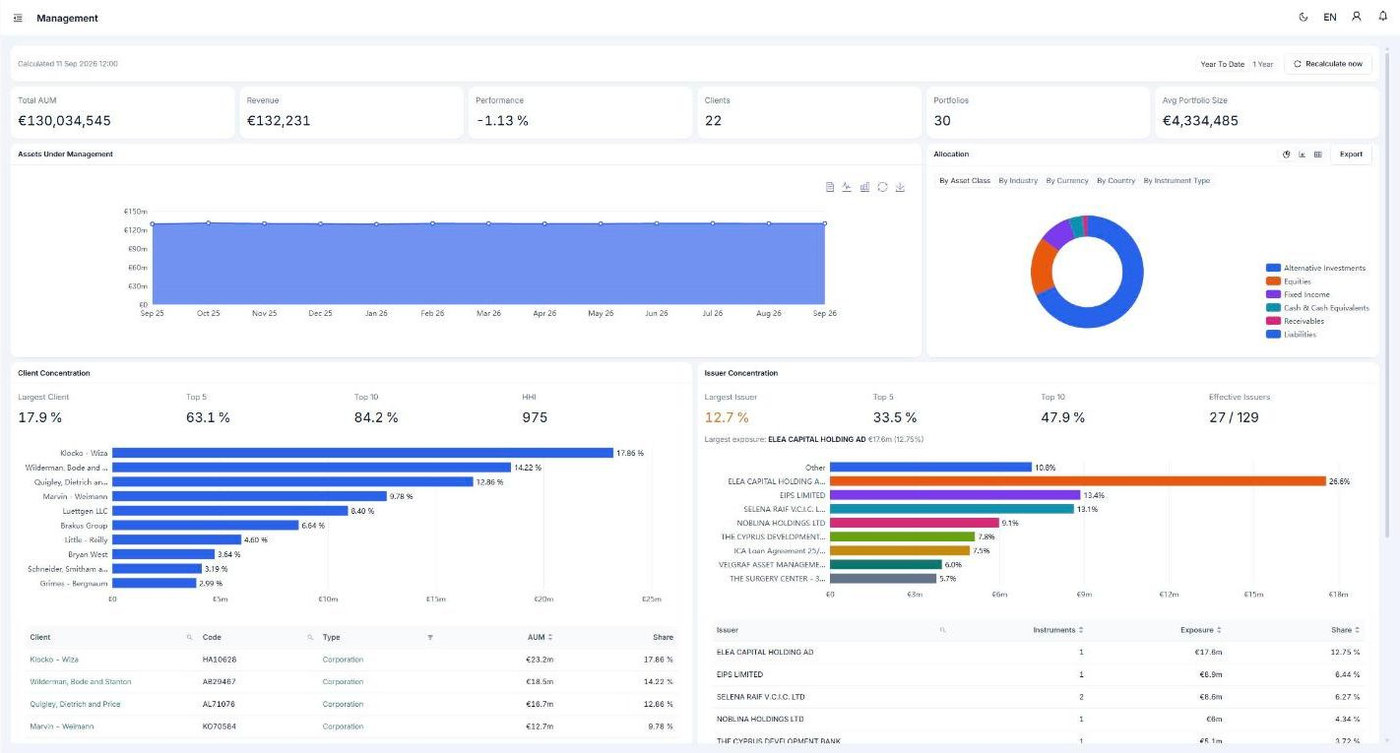
Management dashboard
How big the book is, how it has moved, what it is made of and who holds it. The header states when the figures were calculated and offers a recalculation rather than pretending to be live.
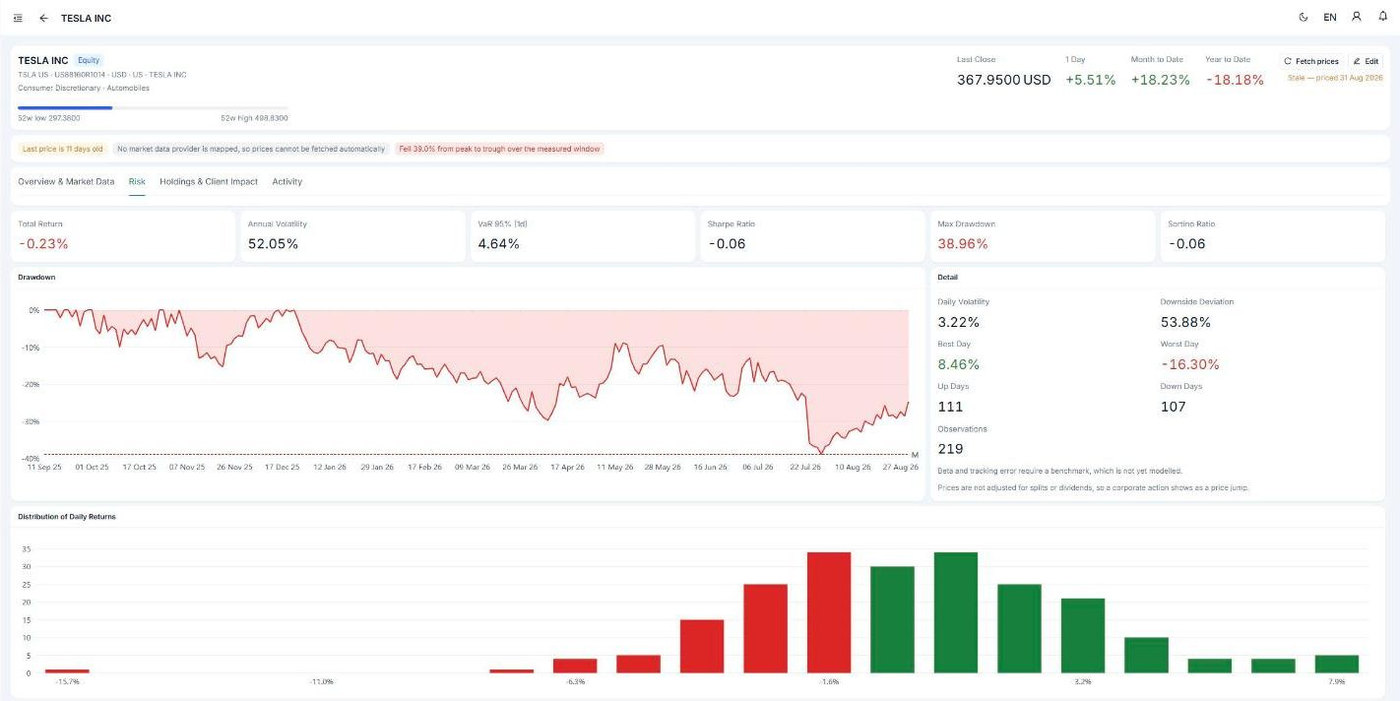
Instrument risk
Total return, annualised volatility, value at risk, Sharpe, maximum drawdown and Sortino, over a drawdown series. Read the footnote: the platform states what it cannot calculate.
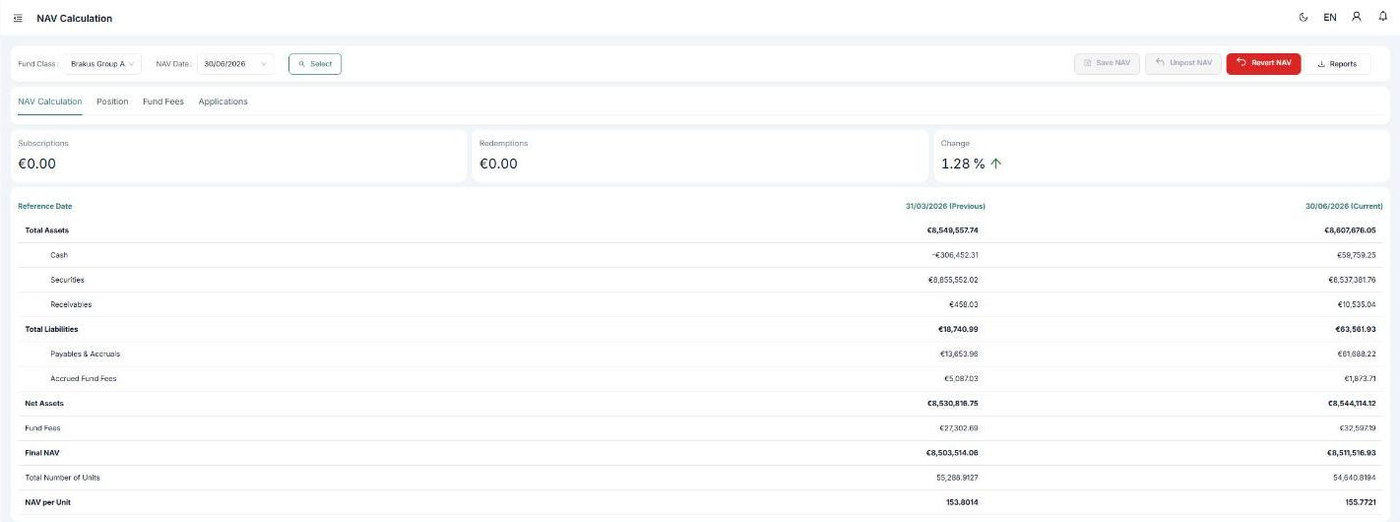
NAV calculation
The bridge for a share class: total assets, liabilities, accrued fund fees and the final NAV per unit, set against the previous reference date. Save, revert, post and unpost sit in the toolbar.
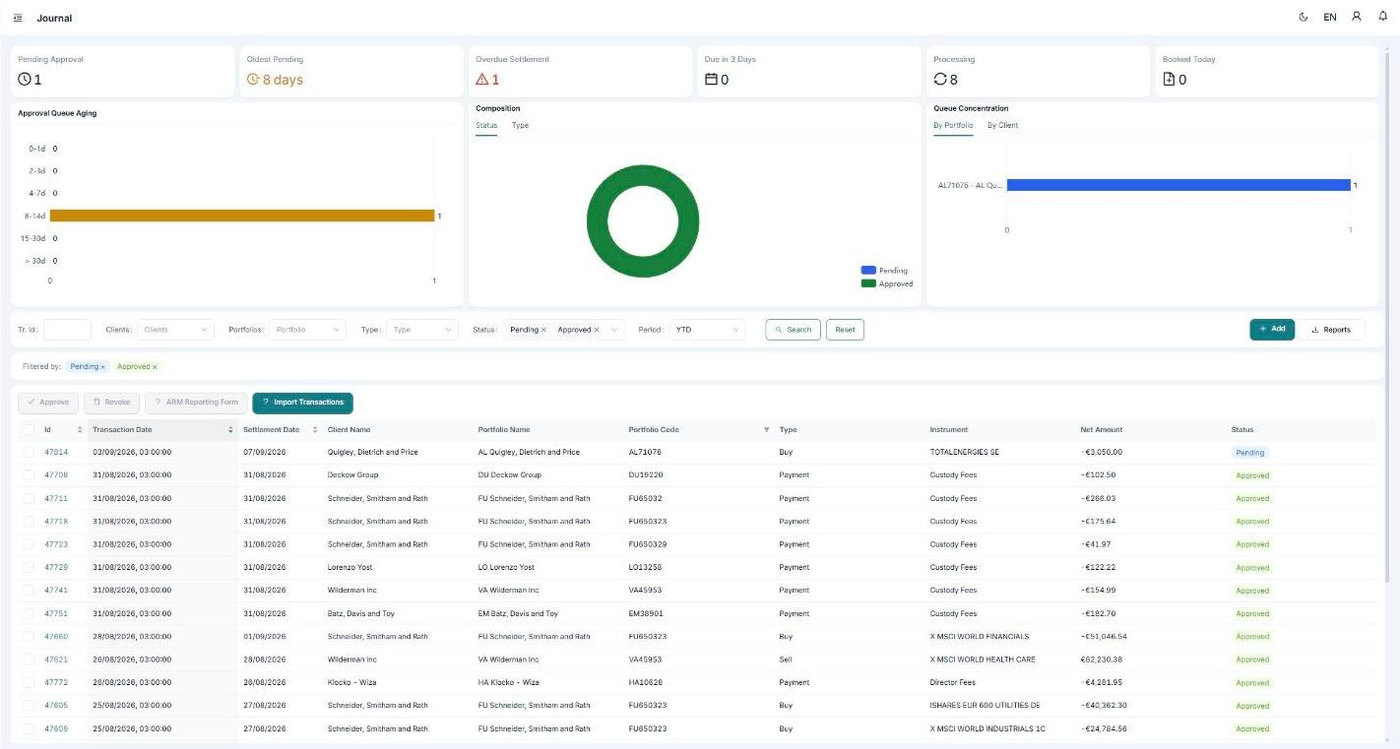
Transaction journal
The approval queue and how long things have waited, what is overdue for settlement, and the blotter underneath. Nothing posts without a second pair of eyes.
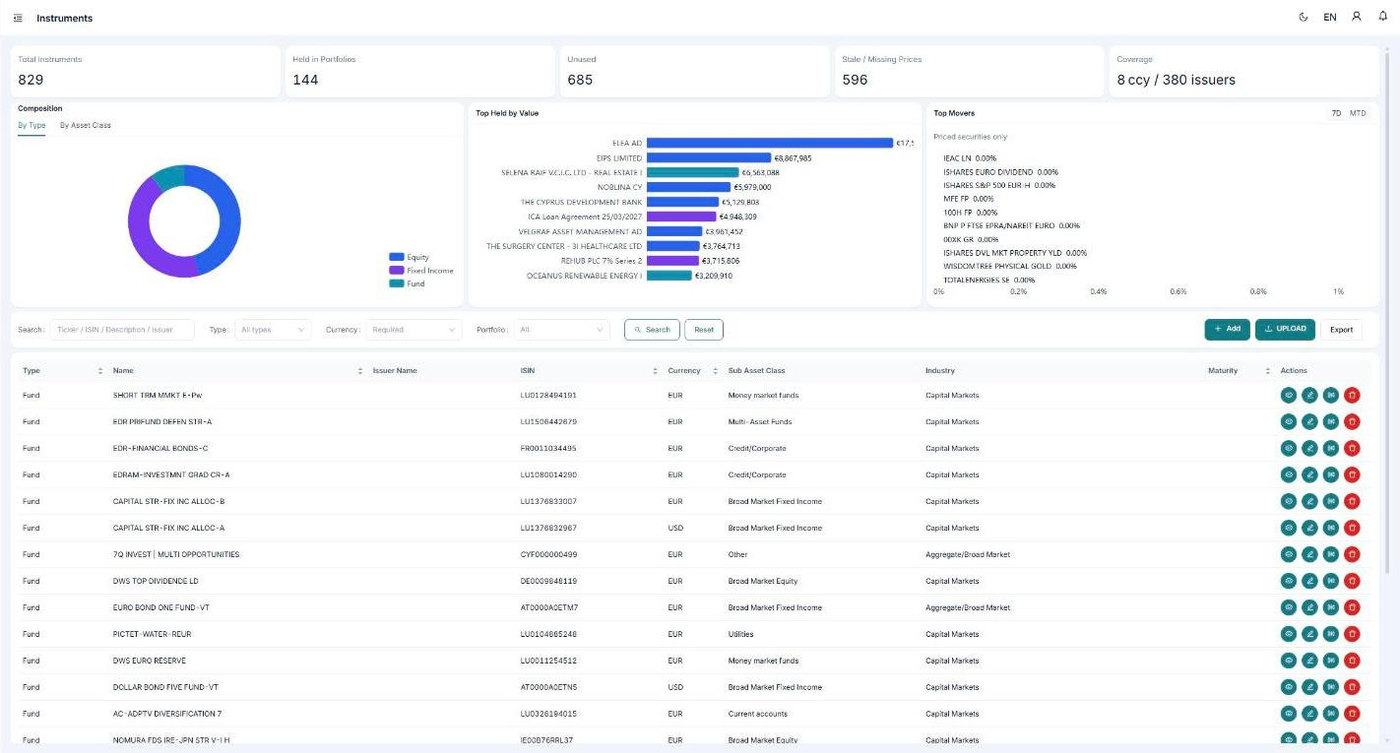
Instrument master
Every instrument the firm holds or can trade, with price coverage, how much of it is stale, composition by type and the largest holdings by value.
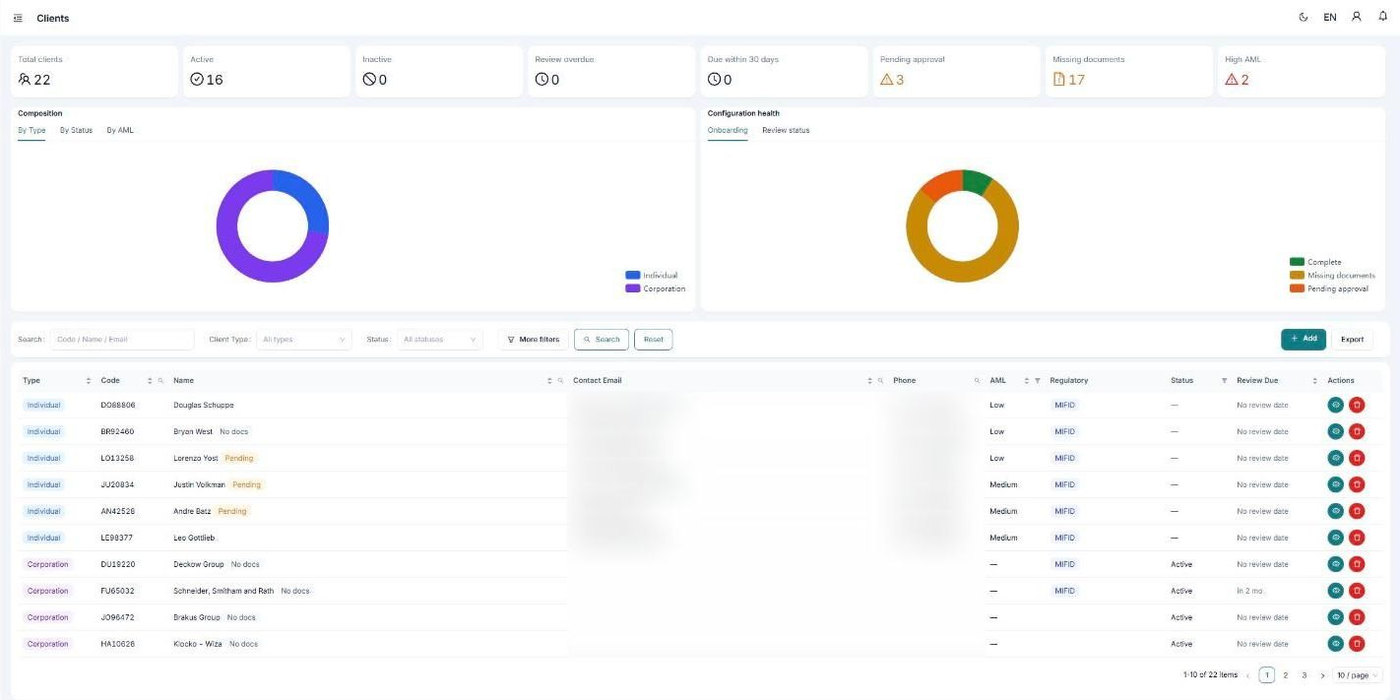
Client book
Clients by type, status and AML risk, with onboarding health and review status above the list. Contact details in this sample are fictional and have been blurred.
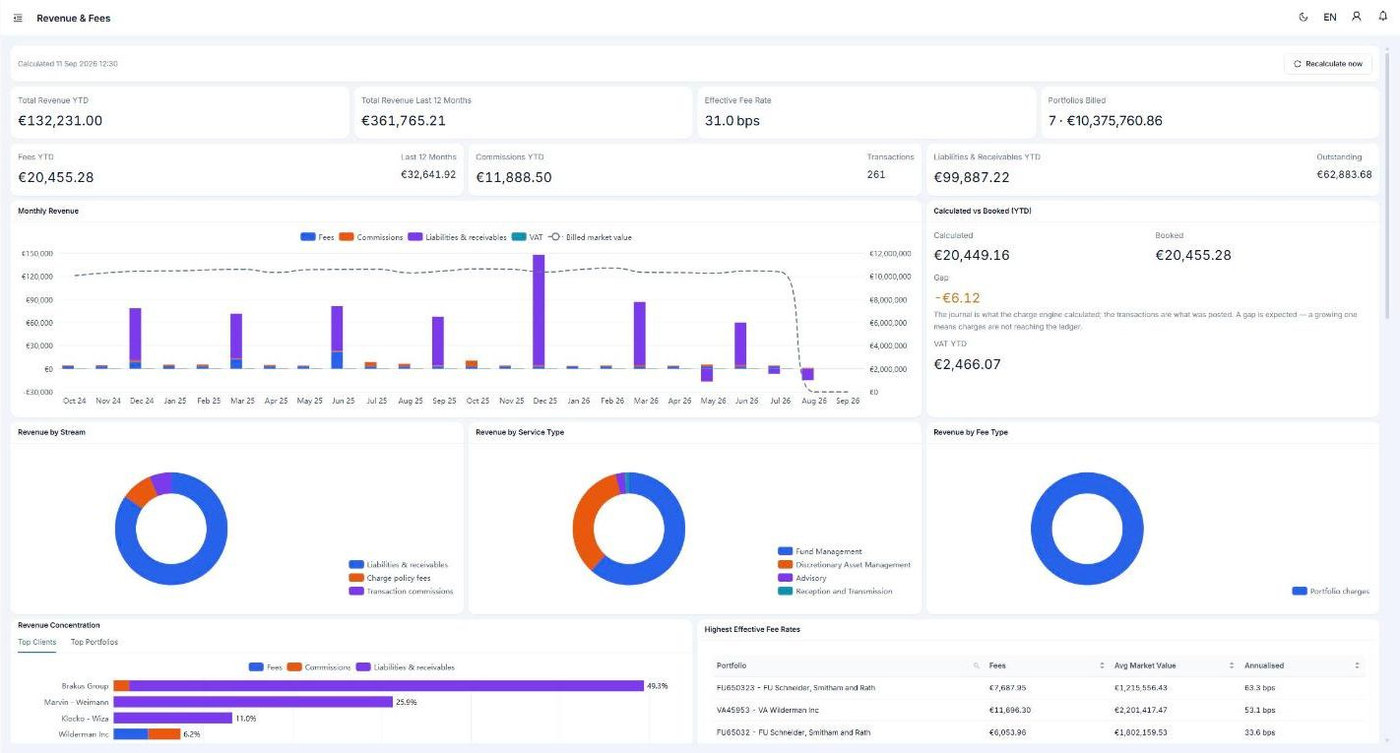
Revenue and fees
Fee revenue year to date and over twelve months, the effective fee rate in basis points, and what the charge engine calculated set against what actually reached the ledger.
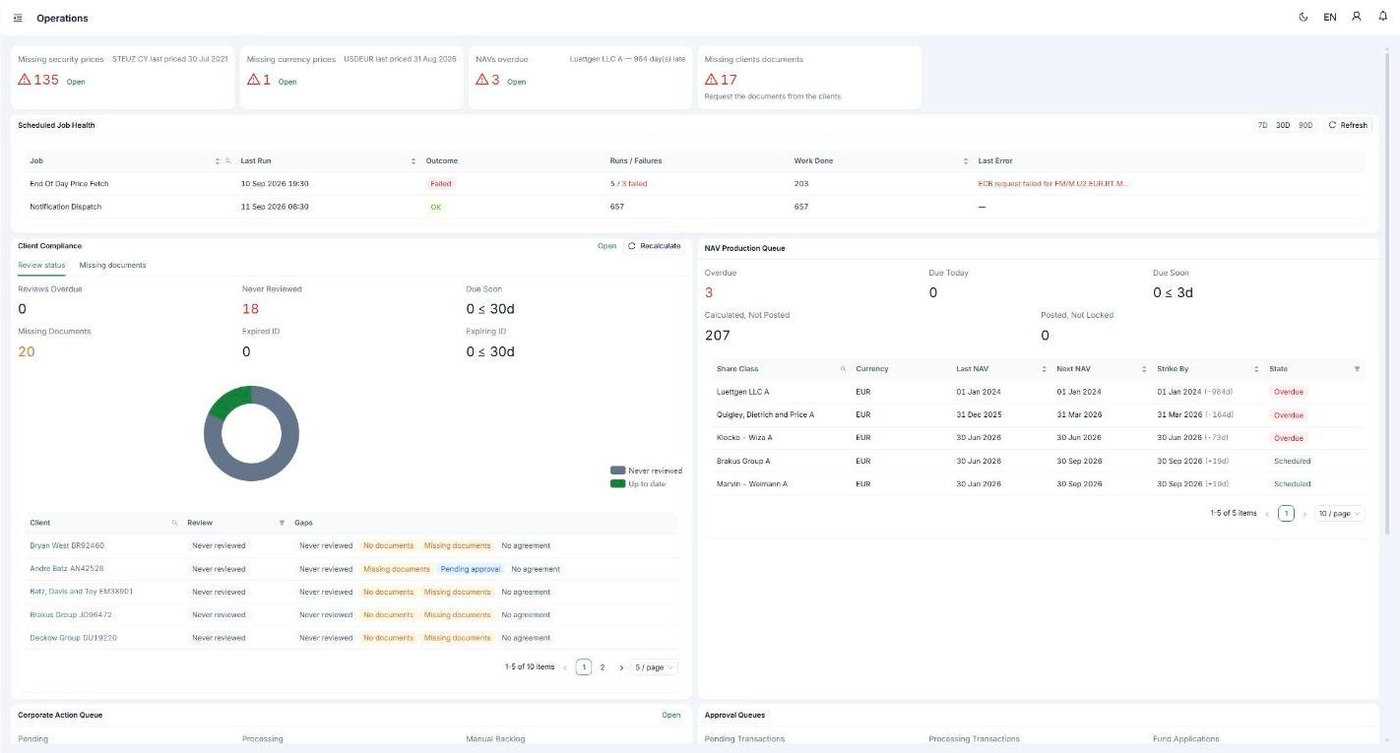
Operations control tower
Missing prices, overdue NAVs, missing client documents, overnight job health, client compliance and the NAV production queue, on the screen operations opens first.
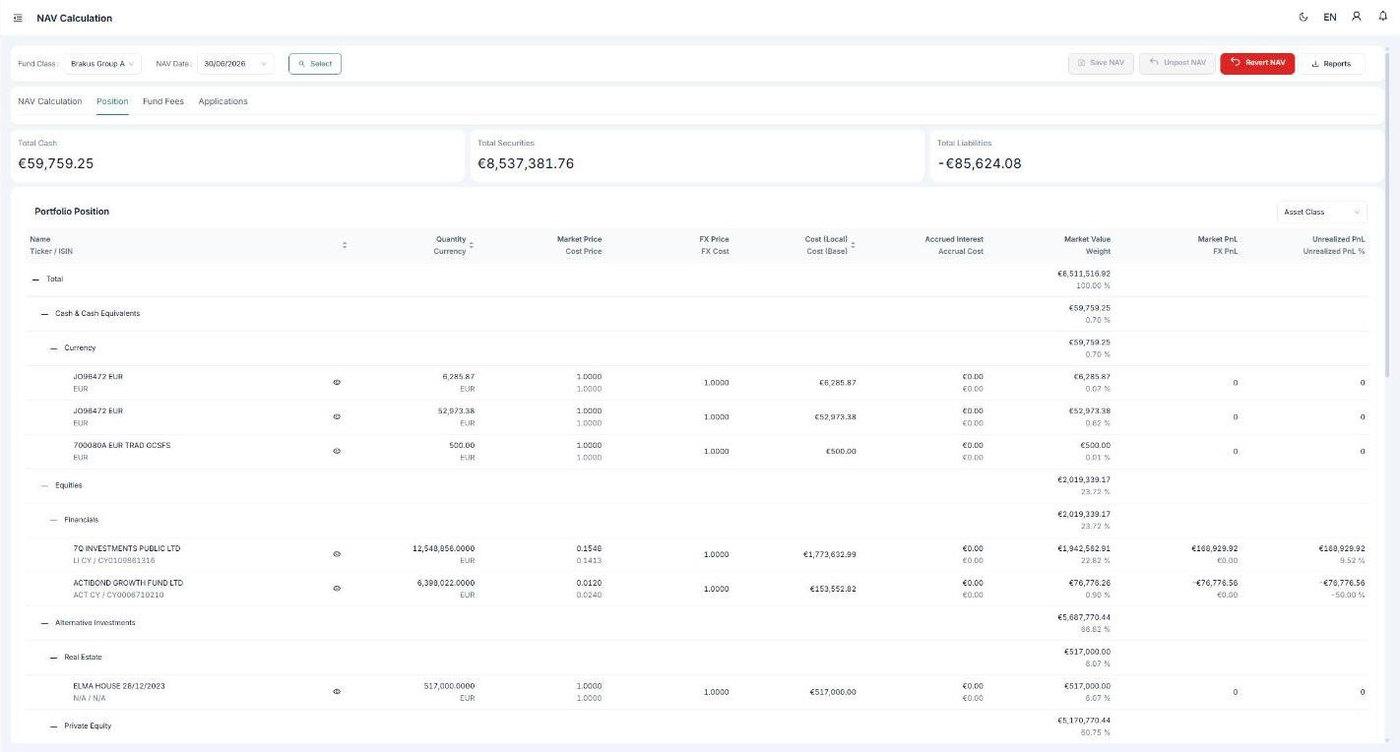
Portfolio position
The live book behind the NAV, grouped by asset class: quantity, market price, FX, cost, accrued interest, market value, weight and unrealised profit and loss.
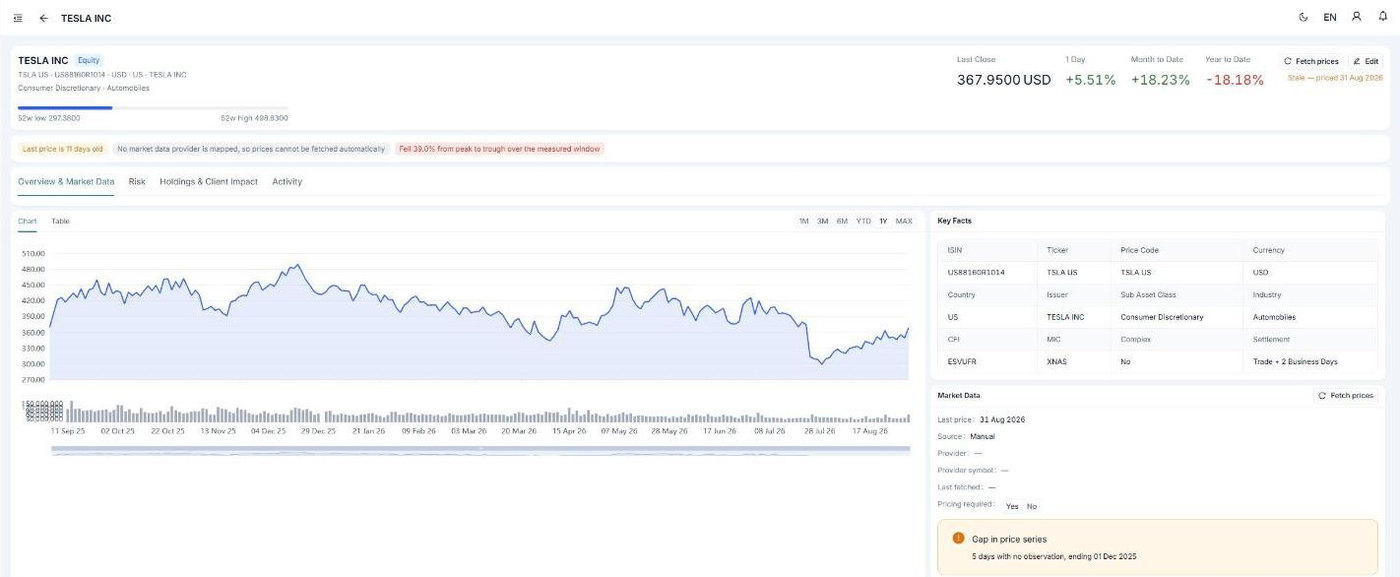
Instrument detail
Price history with traded volume, the 52-week range, performance over one day, month to date and year to date, and a warning where the price series has a gap.
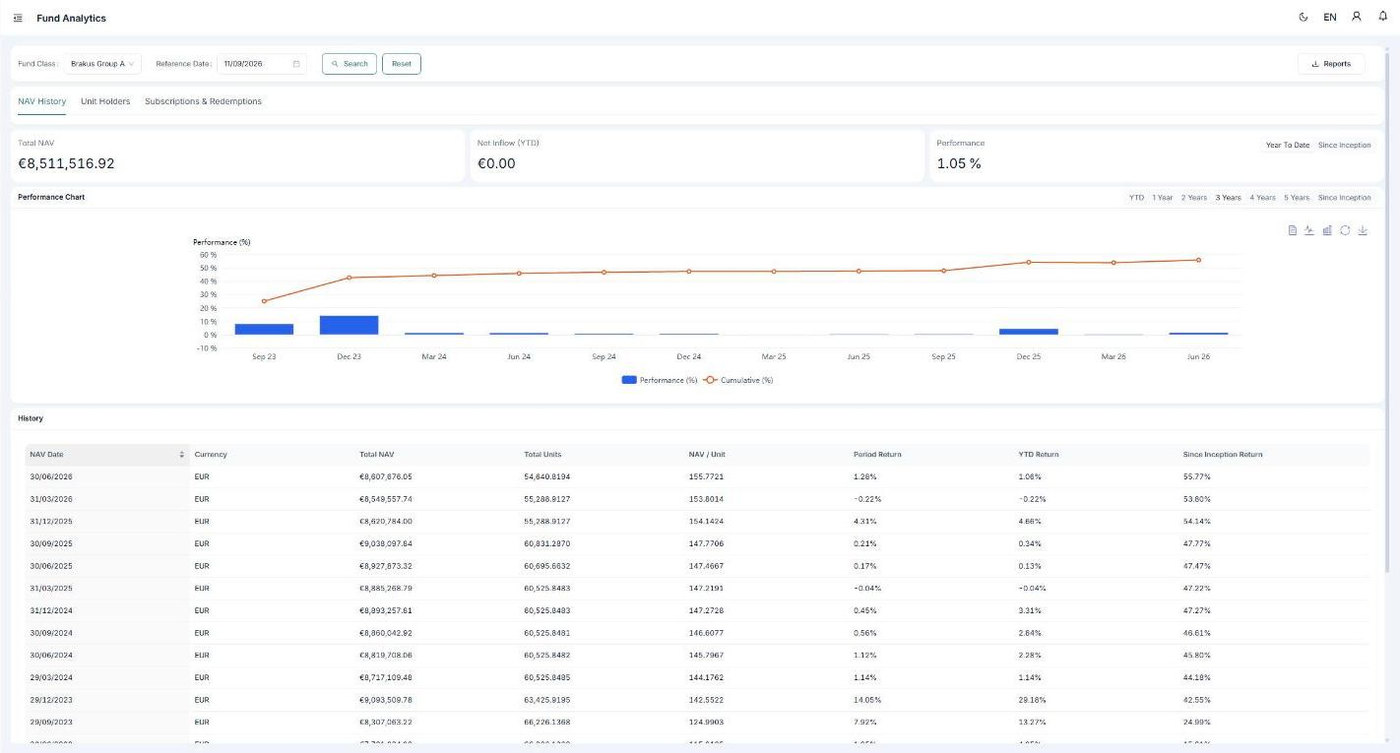
Fund analytics
NAV history for a share class, with performance per period and since inception, and the full table of NAV dates, units and NAV per unit behind the chart.
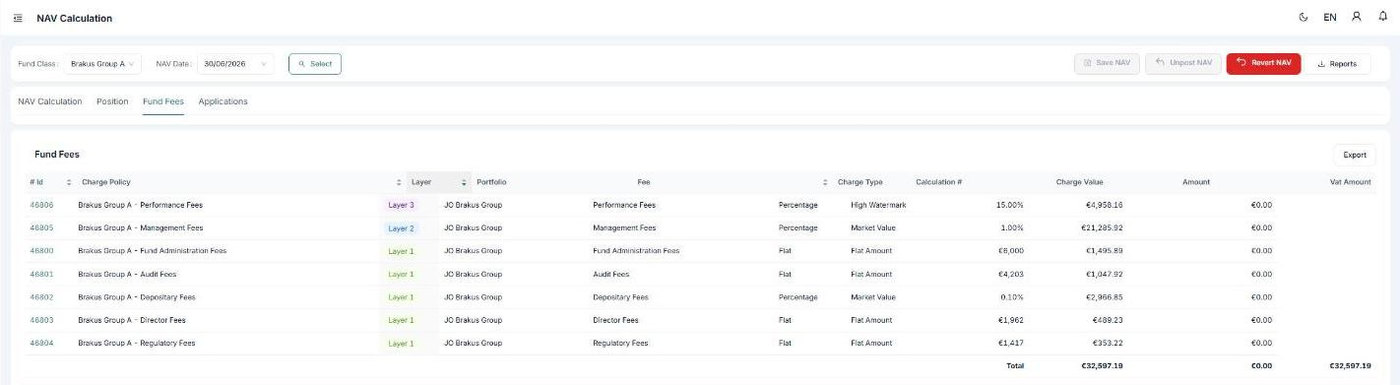
Fund fees
The fee waterfall for a NAV run, layer by layer: performance fees on a high watermark, management fees on market value, and flat administration, audit, depositary, director and regulatory fees.
01Portfolios & positions
Portfolios with more than one owner, more than one currency and a clear audit trail.
Model each portfolio with multi-owner allocation percentages and its own base currency. Holdings, valuations and performance update from the same transaction book, and every portfolio is bound to a charge policy so fees never drift from what was agreed.
What you get
- Multi-currency portfolios with multi-owner allocation percentages
- Holdings, valuations and performance from one transaction book
- Consolidated client-level position across portfolios
- Charge-policy binding on every portfolio
- Valuation and position statements as PDF and CSV
02Transactions
Nineteen transaction types. One approval workflow.
Buy and sell, FX, cash, transfers, free deliver and receive, fixed-term deposits from opening to maturity or early redemption, interest, income, fund subscriptions and redemptions, capital changes, fees, liabilities and receivables, accounting entries and cashflows. Every one of them goes through dual control before it touches a position.
What you get
- 19 transaction types across securities, cash, FX, deposits and funds
- Maker-checker approval before anything posts
- Corporate actions: cash dividend, capital return, split, rights issue
- Maturities diary for deposits and bonds
- Excel and CSV import for bulk entry
03Fund administration & NAV
A NAV you can calculate, review, post and, if you must, unpost.
Define funds and share classes, then run the NAV from positions, fees, custom charges and your chosen price sources. Save it, review it, post it. Unit holders, subscription and redemption applications with approval, fund fees and NAV reports live in the same place. Lockup overrides are explicit and attributed.
What you get
- Funds and share classes, linked to their portfolios
- NAV calculation with save, revert, post and unpost
- Unit-holder register
- Subscription and redemption applications with approval
- Fund fees and server-generated NAV reports
- Lockup-period overrides, recorded and attributed
04Investment management
Mandates you can enforce, not just file.
Risk profiles carry an objective, allocation bands and up to thirteen constraint types. Trade universes are versioned, strategies are approved before they bind a portfolio, and the optimiser proposes allocations with the method you choose. Drift and breach monitoring shows what has moved, how severely, and whether it is improving over 7, 30 and 90 days.
What you get
- Objectives: capital preservation, growth, income, inflation protection, absolute return
- Constraints: volatility, VaR, single issuer, sector, country, currency, duration, high-yield share, credit rating, liquidity and more
- Versioned trade universes with a draft and approval workflow
- Investment strategies: draft, pending approval, approved, invalidated
- Optimiser: Max Sharpe, Min Volatility, Efficient Return, Efficient Risk, Risk Parity
- Expected returns by historical mean, EMA or CAPM; covariance by sample, Ledoit-Wolf, semicovariance or EWMA
- Drift and breach monitoring with severity and 7, 30 and 90-day trends
Mockup of an efficient frontier chart with optimisation methods, and a mandate breach monitor with constraint limits.
Mockup of an efficient frontier chart with optimisation methods, and a mandate breach monitor with constraint limits.
05Risk & performance analytics
The numbers a mandate review needs, calculated the same way every time.
Time-weighted return, volatility, Sharpe against a stated risk-free rate, historical and parametric value at risk, maximum drawdown, fixed-income duration and credit quality, liquidity and concentration. Drill into any instrument to see who holds it, what has happened to it and how risky it is.
What you get
- Time-weighted return and annualised volatility
- Sharpe ratio against a stated risk-free rate
- Historical 95% one-day VaR and parametric VaR
- Maximum drawdown with the full drawdown series
- Duration, spread duration, weighted credit rating, liquidity ratio
- Herfindahl-Hirschman concentration for clients and issuers
- Instrument drilldown: holders, activity, risk
06Fees & revenue
Fees calculated from policy, not from memory.
Charge policies apply at portfolio, fund or transaction level, on average end-of-day, end-of-month or end-of-quarter market value. Performance fees respect high-watermark and hurdle. VAT is applied where it belongs, every charge is journaled, and the revenue dashboard shows the trend, the split by fee type and your effective fee rate.
What you get
- Portfolio, fund and transaction charge policies
- Bases: average end-of-day, end-of-month or end-of-quarter market value
- Performance fees with high-watermark and hurdle, layered if needed
- VAT on charges where applicable
- Charges journal with recalculation
- Revenue dashboard: trend, split by fee type, effective fee rate
07Accounting
A general ledger that is fed by the same transactions your portfolios are.
Every posted transaction creates its accounting entries. The chart of accounts starts from a template linked to each fund, the general ledger, profit and loss, balance sheet and trial balance close by accounting period, and a closed period can be locked so nothing moves after the auditor has seen it.
What you get
- Chart of accounts with templates per fund
- General ledger fed directly by posted transactions
- Profit and loss, balance sheet and trial balance
- Accounting periods: open, close, lock, and a reversible reset
- Account categories for realised and unrealised gains, income, expenses, capital and revaluation
Mockup of a trial balance table with debit and credit columns for an accounting period.
08Client lifecycle & compliance
From first contact to periodic review, with the evidence attached.
An onboarding wizard for individuals and corporates collects categorisation, knowledge and experience, source of wealth and risk profile in the order the regulation expects. Periodic reviews are tracked, documents live in a vault, and MiFIR transaction reports go out through your ARM.
What you get
- Onboarding wizard for individuals and legal entities
- KYC and AML risk categorisation: low, medium, high
- MiFID II and AIFMD client categorisation with the elective professional questionnaire
- MiFIR document requirements per country
- Source-of-wealth and wealth-breakdown declarations
- Periodic reviews: OK, due soon, overdue, missing
- Document vault by subject: identity, address, corporate, regulatory, source of wealth
- MiFIR and ARM transaction reporting, including Athex export
09Client portal
The portal your clients open instead of calling.
Clients see performance, income received, cost and top holdings on a branded dashboard, in English or Greek, light or dark, on any device. Statements and documents arrive through secure expiring links. Two-factor authentication guards the way in.
What you get
- Dashboard: performance, income received, cost, top securities
- Consolidated position across portfolios
- Statements and valuations on demand
- Secure, expiring document links
- Two-factor authentication
- English and Greek, light and dark, mobile friendly
Mockup of a client portal card on a phone showing performance, income and a download statement button.
10Platform & governance
Who can see what, and who can approve what, written down once.
Roles are configurable per tenant. Teams are assigned portfolios and funds in bulk, and access can be direct, inherited through a team or derived from client ownership. Fund and portfolio roles keep the administrator, the manager, the risk manager and the accountant in their own lanes.
What you get
- Configurable roles and teams
- Portfolio and fund assignment: direct, inherited, by client ownership
- Fund roles: administrator, manager, risk manager, investment analyst, relationship manager, fund accountant, management, observer
- Portfolio roles: primary and secondary advisor, reviewer, observer
- In-app notifications by role
- Report templates with versions, tenant footnote and disclaimer
- White-label logo and platform details
- OpenID Connect single sign-on
Mockup of a role permissions matrix showing which roles can view, create, approve and post.
11Operations control tower
The morning screen for operations.
What has broken, what is queued and what is late. The control tower shows the NAV queue, corporate actions waiting, approvals pending, accounting periods overdue, overnight job health and clients whose reviews are due. Management gets its own view: AUM, growth, composition, top clients and concentration.
What you get
- NAV queue, corporate action queue and approval queues
- Overdue accounting periods
- Overnight job health: price refresh, corporate actions, strategy re-checks
- Client compliance panel
- Management dashboard: AUM, growth, composition, top clients, concentration
- Pluggable market-data providers with scheduled price refresh, coverage and gap detection
Want to see a specific module?
Tell us which ones in the demo request and we will build the walkthrough around them.
Or write to us at [email protected]